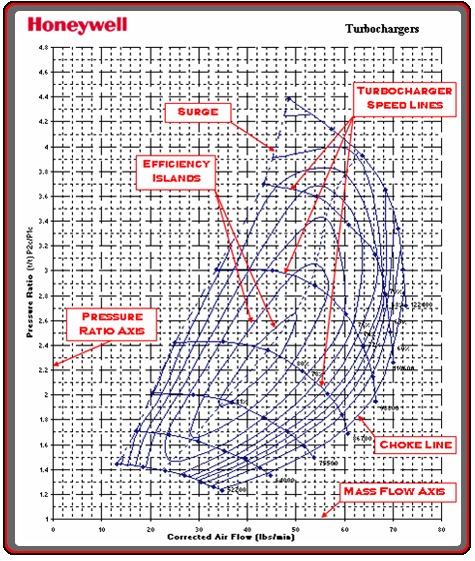
Compressor map
Jump to navigation
Jump to search
- Pressure ratio (y-axis)
- The absolute inlet pressure divided by the absolute outlet pressure.
- Mass air flow rate (s-axis)
- The mass of air flowing through the intake/compressor over time. Usually lbs/min or CFM.
- Surge line
- The left hand boundary of the map, where the air flow is too low for the current pressure ratio. Blow off valves or bypass valves are often used to relieve excess pressure to prevent sudden off throttle induced pressure surges.
- Choke line
- The right hand boundary of the map, where the turbo is approaching its flow limit and maximum shaft speed.
- Turbo speed lines
- The lines of constant turbo shaft speed.
- Efficiency islands
- The concentric regions on the map representing compressor efficiency. The smallest island in the center of the map is the "sweet spot", or where turbo is the most efficient.
An excellent source of more information can be found here.
