Compressor map: Difference between revisions
Jump to navigation
Jump to search
Content deleted Content added
| Line 40: | Line 40: | ||
A few others: |
A few others: |
||
*[http://www.google.com/search?q=%281+atm+%2B+1+bar%29%2F%281+atm+-+1+psi%29%3D <code> |
*[http://www.google.com/search?q=%281+atm+%2B+1+bar%29%2F%281+atm+-+1+psi%29%3D <code>(1 atm + 1 bar) / (1 atm - 1 psi) = 2.13199706</code> ] |
||
*[http://www.google.com/search?q=%281+atm+%2B+1.3+bar%29%2F%281+atm+-+1+psi%29%3D <code> |
*[http://www.google.com/search?q=%281+atm+%2B+1.3+bar%29%2F%281+atm+-+1+psi%29%3D <code>(1 atm + 1.3 bar) / (1 atm - 1 psi) = 2.44969189</code> ] |
||
*[http://www.google.com/search?q=%281+atm+%2B+22+psi%29%2F%281+atm+-+1+psi%29%3D <code> |
*[http://www.google.com/search?q=%281+atm+%2B+22+psi%29%2F%281+atm+-+1+psi%29%3D <code>(1 atm + 22 psi) / (1 atm - 1 psi) = 2.67932871</code> ] |
||
*[http://www.google.com/search?q=%281+atm+%2B+24+psi%29%2F%281+atm+-+1+psi%29%3D <code> |
*[http://www.google.com/search?q=%281+atm+%2B+24+psi%29%2F%281+atm+-+1+psi%29%3D <code>(1 atm + 24 psi) / (1 atm - 1 psi) = 2.82535729</code> ] |
||
==Mass Air Flow== |
==Mass Air Flow== |
||
Revision as of 02:49, 13 September 2006

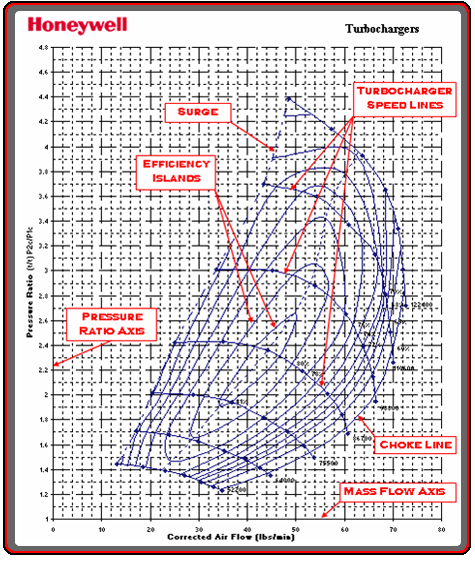
- Pressure ratio (y-axis)
- The absolute inlet pressure divided by the absolute outlet pressure.
- Mass air flow rate (x-axis)
- The mass of air flowing through the intake/compressor over time. Usually lbs/min or CFM.
- Surge line
- The left hand boundary of the map, where the air flow is too low for the current pressure ratio. Blow off valves or Bypass valves are often used to relieve excess pressure to prevent sudden off throttle induced pressure surges.
- Choke line
- The right hand boundary of the map, where the turbo is approaching its flow limit
- Overspeed line
- The top boundary of the map, where the turbo is approaching its maximum shaft speed. Past this point, the turbo is liable to "overspin" and cause catastrophic bearing failure.
- Turbo speed lines
- The lines of constant turbo shaft speed.
- Efficiency islands
- The concentric regions on the map representing compressor efficiency. The smallest island in the center of the map is the "sweet spot", or where turbo is the most efficient.
An excellent source of more information can be found here.
Pressure Ratio
Expressed as or, more commonly,
Where is manifold absolute pressure, is ambient air pressure.
Note that is intercooler pressure drop (pressure difference between and MAP), and is intake pressure drop (pressure difference between and ).
Alternately, if boost is known, it is approximated by . Intercooler drop is ignored here for simplicity.
Example
Google calculator provides a handy way to deal with unit issues.
For example, with 20psi boost and 1psi inlet drop, type this into google (assuming you live at sea level):
(1 atm + 20 psi)/(1 atm - 1 psi)=
and you get:
((1 atm) + (20 psi)) / ((1 atm) - (1 psi)) = 2.53330013 , or a pressure ratio of approximately 2.5
A few others:
(1 atm + 1 bar) / (1 atm - 1 psi) = 2.13199706(1 atm + 1.3 bar) / (1 atm - 1 psi) = 2.44969189(1 atm + 22 psi) / (1 atm - 1 psi) = 2.67932871(1 atm + 24 psi) / (1 atm - 1 psi) = 2.82535729